A farmer reports hail damage across 400 acres. The insurer now needs to answer a simple question: did the storm actually damage this specific field, and how much?
Traditionally, that means processing the claim, gathering records, and, when necessary, sending a loss adjuster to inspect the crop in person. The USDA notes that such inspections are a must because damage needs to be assessed before crops are harvested or otherwise disposed of.
The scale makes this process harder. In the US alone, more than 543 million acres were insured through the Federal Crop Insurance Program in 2024, with total liabilities exceeding $192 billion.
AI can help insurers move the first decision upstream. By correlating satellite imagery, weather data, field boundaries, crop records, and claim documents, an automated system can assess whether the reported event matches conditions on the ground and help separate routine claims from those that need closer investigation.
For insurers, automating agricultural insurance claims means collecting and comparing the evidence before an adjuster starts the review. Satellite imagery, weather data, and farm records can show what happened at the field and when, giving adjusters a clearer starting point for each claim.
The Data Sources: What Makes This Problem Uniquely Complex
Agricultural insurance technology has to work with a type of evidence that is naturally scattered. No single dataset can fully explain what happened to a crop.
Satellite imagery can show changes in vegetation before and after a reported event. But useful images depend on revisit frequency, resolution and weather conditions. Cloud cover, for example, can make optical imagery unavailable exactly when it is needed.
Weather data adds another piece of the picture by showing whether hail, heavy rain, drought or another reported event occurred. The challenge is that weather observations do not always match conditions in a specific field. Data from a nearby station may need to be interpolated or combined with other sources to estimate what happened at the insured location.
Then there are the farm records. Planting dates, crop types, farming practices and yield history provide essential context, but this information may come from different systems or directly from the farmer.
Field boundaries create another challenge. They define exactly which land is insured, yet GIS data can vary in quality, format and accuracy.
This is what makes precision agriculture insurance different from many other insurance workflows. The process isn't simply collecting data from one source. It is connecting multiple satellite observations, weather events, field locations and farm records into a reliable picture of what happened on one specific piece of land.
Satellite İmagery: Detecting Crop Stress Before and After the Event
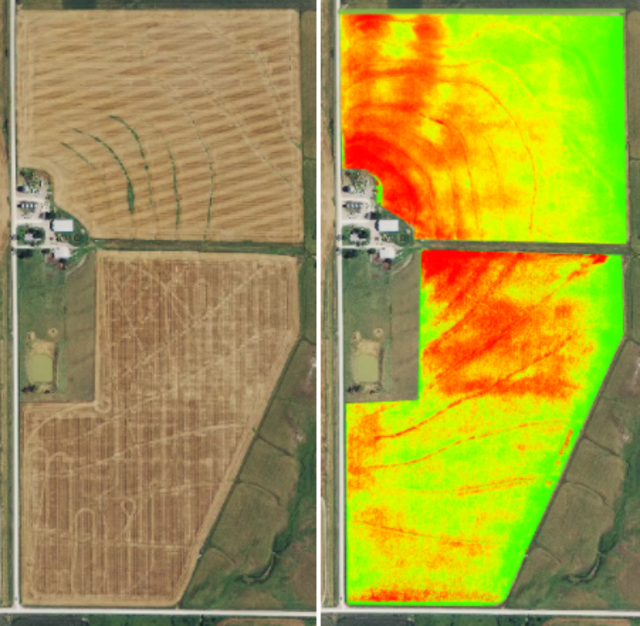
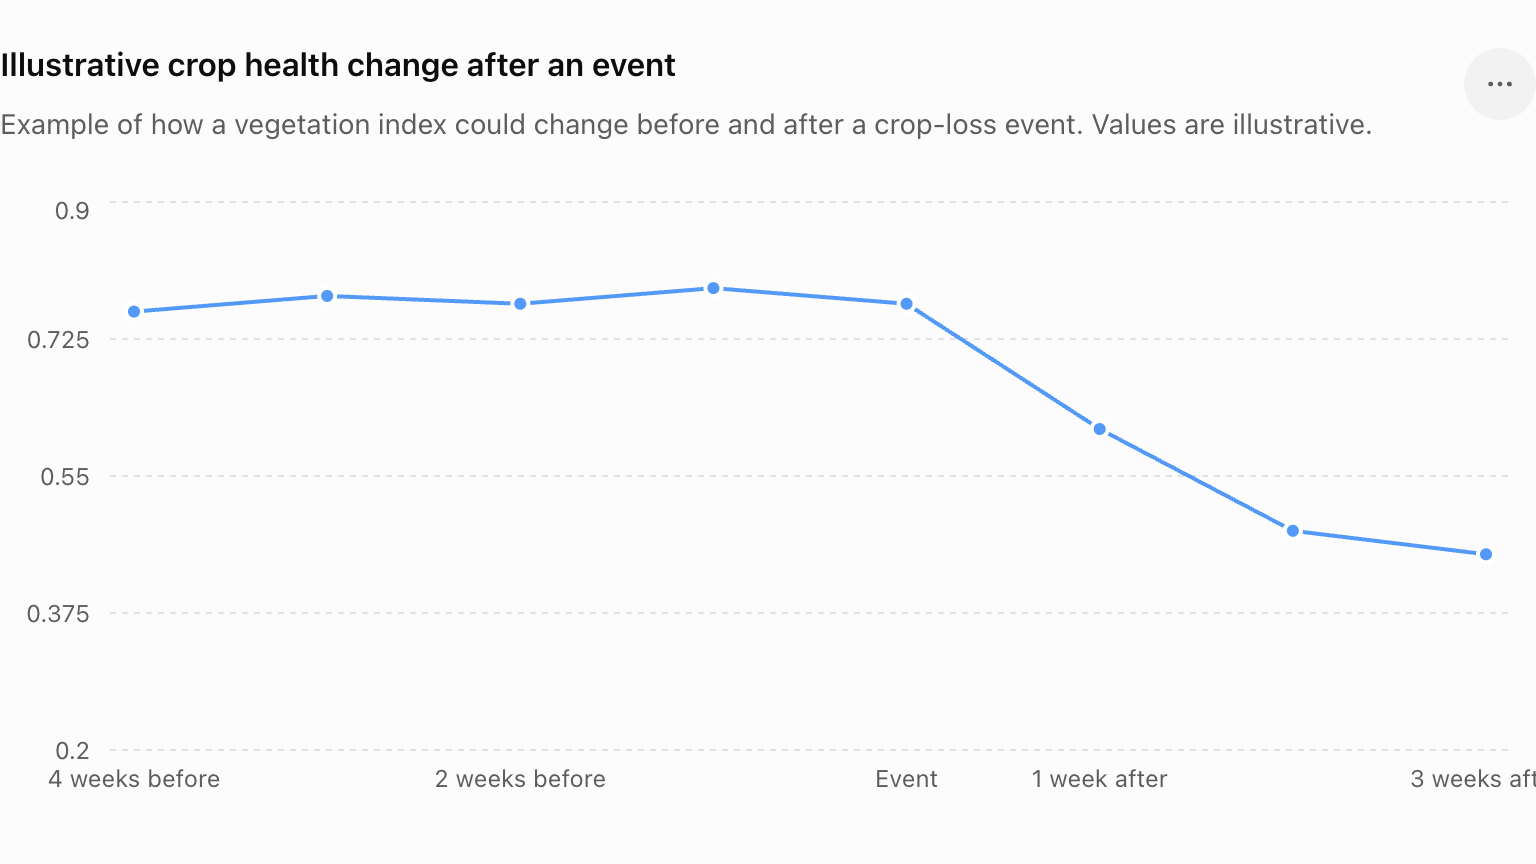
Satellite imagery can help farmers and insurers see how crops change across an entire field without relying only on physical inspections. With satellite crop monitoring, teams can establish a picture of crop health before an event and compare it with imagery captured afterward.
One of the most widely used measures is the Normalized Difference Vegetation Index (NDVI). It compares how vegetation reflects red and near-infrared light. Healthy green vegetation generally absorbs more red light and reflects more near-infrared light, resulting in higher NDVI values. A drop can indicate vegetation stress or damage.
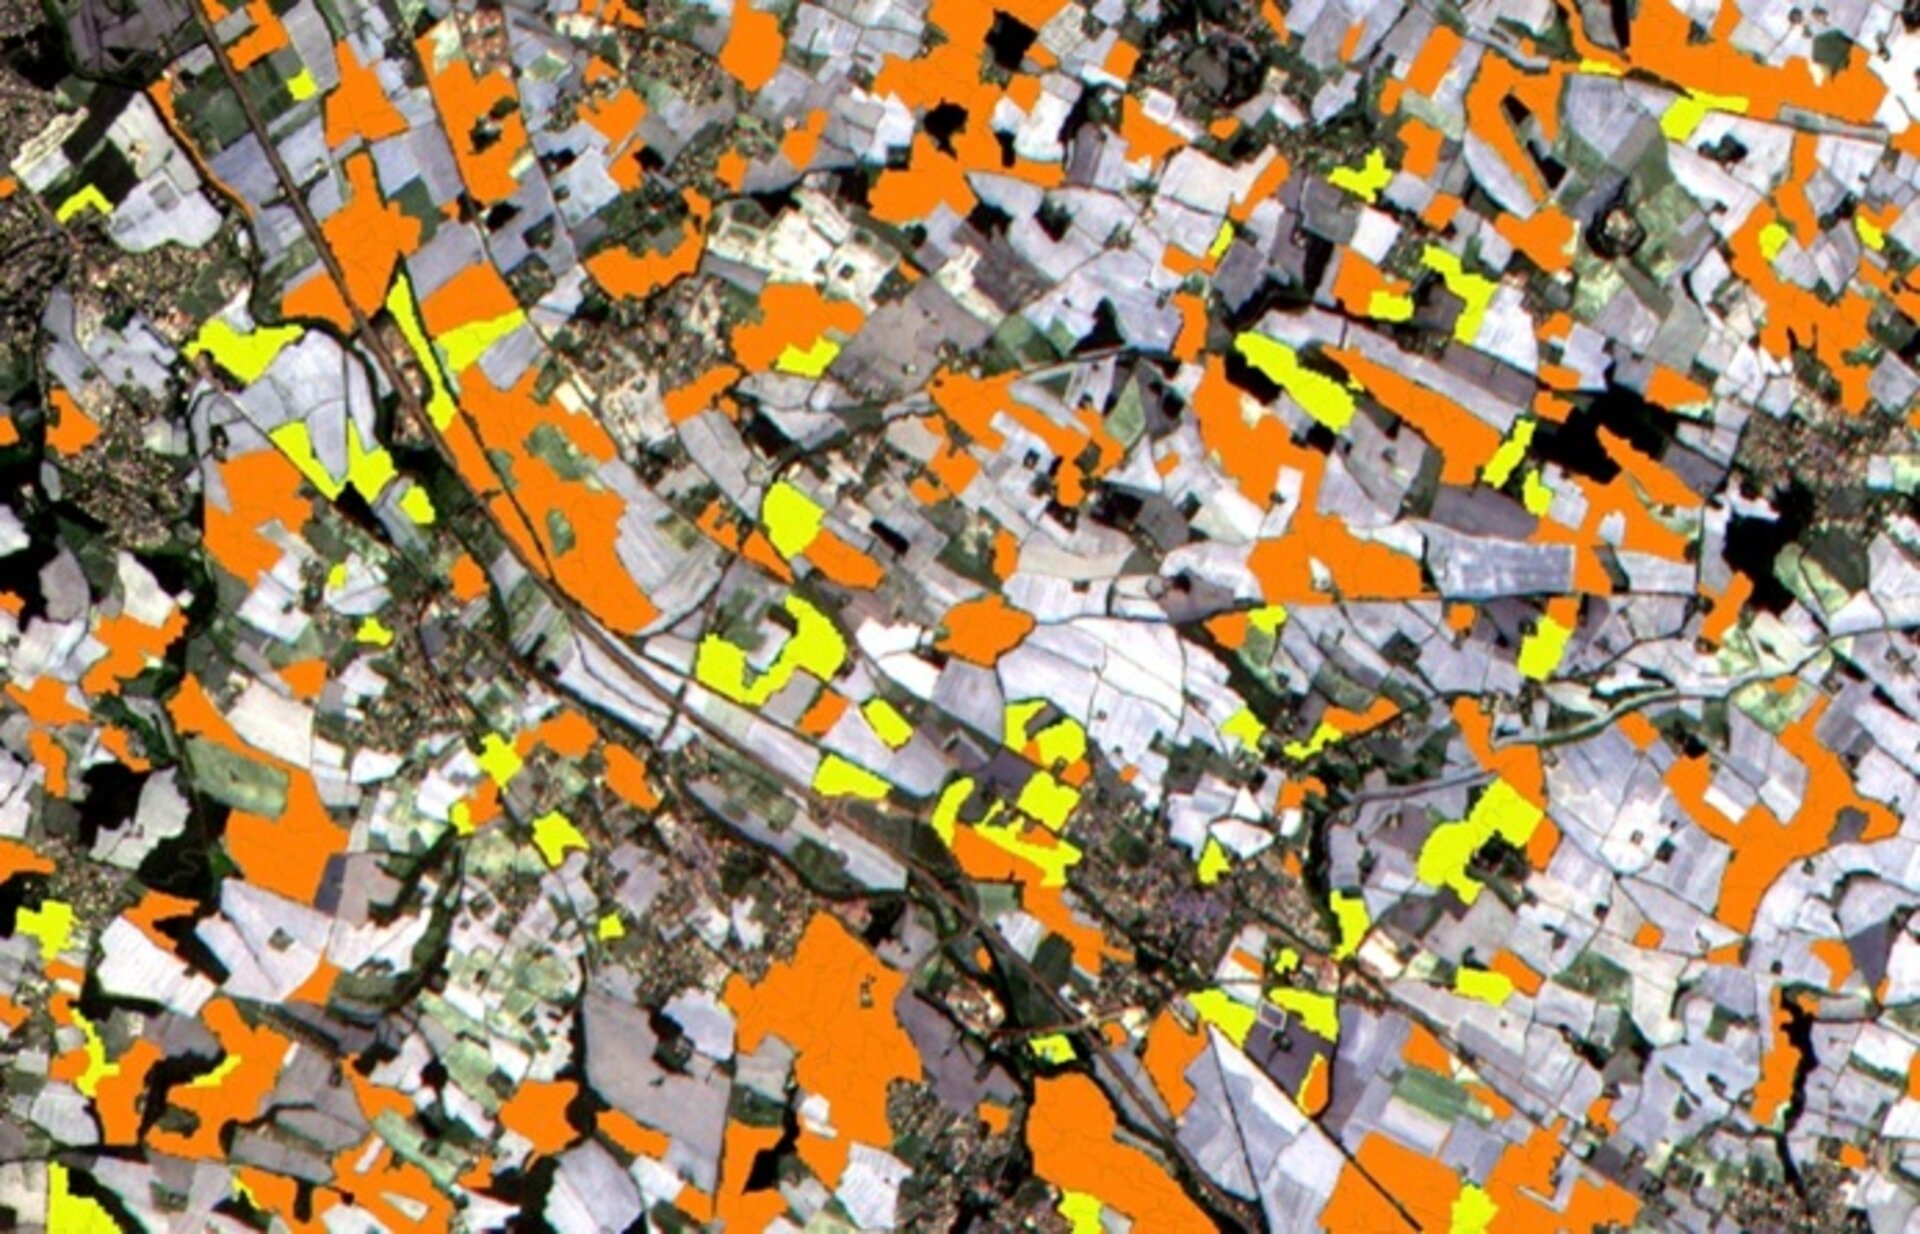
NDVI is not the only option. Other vegetation indices can provide information about leaf chlorophyll, water content, and canopy condition. This is one reason Sentinel satellite agriculture applications are so useful. The European Space Agency's Sentinel-2 mission has 13 spectral bands, including red-edge and shortwave infrared bands that range at resolutions from 10 to 60 meters and can provide additional information about vegetation health and
Comparing the field before and after an event
A reliable NDVI crop loss analysis starts with a baseline rather than the damaged image itself.
A typical workflow is:
- Collect several images from before the event.
- Build a baseline for the field's normal vegetation condition.
- Capture imagery after the event.
- Compare the new vegetation indices with the baseline.
- Map areas where vegetation condition has changed significantly.
- Combine the results with weather data, field boundaries, crop type, and ground observations.
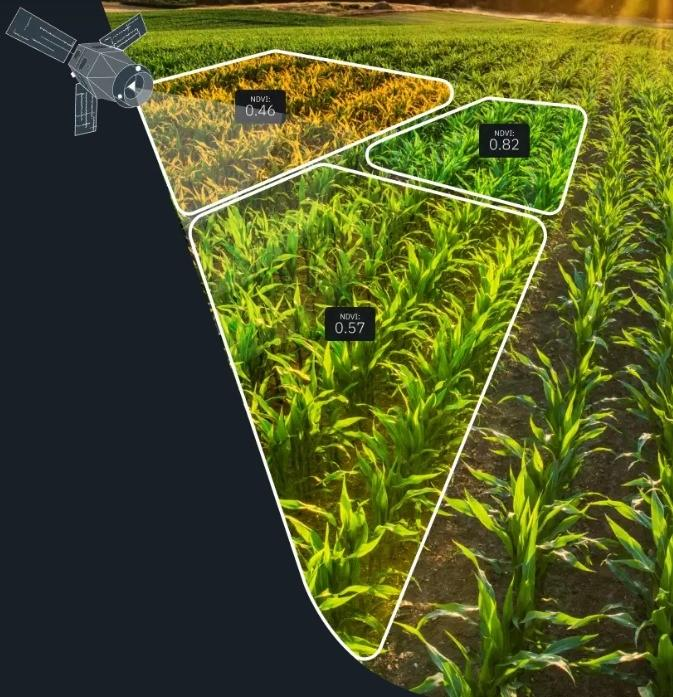
This matters because a low NDVI value does not automatically mean that a crop was damaged. Vegetation naturally changes throughout the growing season, and NDVI values can fluctuate in response to both plant development and changing environmental conditions.
Over time, these changes can help reveal broader patterns of vegetation stress. For example, USGS research uses satellite observations of vegetation alongside climate and other environmental data to monitor how plants respond to drought conditions.
How different damage can appear
Different events can produce different spatial and spectral patterns, although satellite data alone cannot always identify the exact cause.
Hail can cause a sudden drop in vegetation indices, often appearing in irregular patches or strips corresponding to the affected area.
Drought usually develops more gradually and can affect larger, continuous areas. Water-sensitive indices and shortwave infrared data can add information about vegetation water stress.
Flooding may first appear as surface water and can later show as a sharp decline in vegetation where crops have been damaged by prolonged inundation.
Pests and disease can produce localized areas of declining vegetation health. Red-edge bands can help detect changes in plant condition, but additional field or weather data is usually needed to confirm the cause.
This makes satellite imagery most useful as one part of a broader monitoring system rather than as a standalone source of truth.
What satellite imagery cannot tell you
There are several practical limitations.
Cloud cover can make optical imagery unusable, especially immediately after storms when timely information is most valuable.
Revisit frequency also matters. Sentinel-2 can revisit the same area approximately every five days when the constellation is fully operational, but clouds can significantly reduce the number of usable images.
Spatial resolution can be a challenge for small fields or narrow damage zones. Sentinel-2 provides 10 m resolution for several key bands, while other bands have 20 m or 60 m resolution. Small affected areas may therefore occupy only a few pixels.
For a complete solution, satellite data can be combined with IoT sensors, weather information, field data, and AI-based analysis. This is where a custom platform can turn raw observations into useful alerts, maps, and reports. Perpetio's IoT app development services cover real-time monitoring, data analytics, alerts, and data visualization, while its AI app development services can support predictive analytics and automated data analysis.
This combination can help turn satellite imagery from a collection of images into an actionable crop monitoring system that shows where something changed, how significant the change is, and what may need attention next.
Weather Data: Did the Event Actually Happen in This Location?
Satellite imagery can show that a crop changed, but weather data can help answer a different question: was there actually a weather event capable of causing the reported damage? This makes weather data crop loss analysis an important part of automated claims verification.
The challenge is that weather stations are not usually located on every farm. A station may be 10 km or more from the field, while hail, heavy rain, and thunderstorms can vary dramatically over much smaller distances. Simply using the nearest station can therefore give a misleading picture of what happened at the field itself.
From weather stations to weather grids
Gridded weather products help fill this gap by estimating weather conditions across a geographic grid rather than at individual station locations.
For example, ERA5 provides hourly estimates of weather variables, including precipitation, on a global grid of about 31 km. It combines weather observations with a numerical weather model to create a consistent historical record.
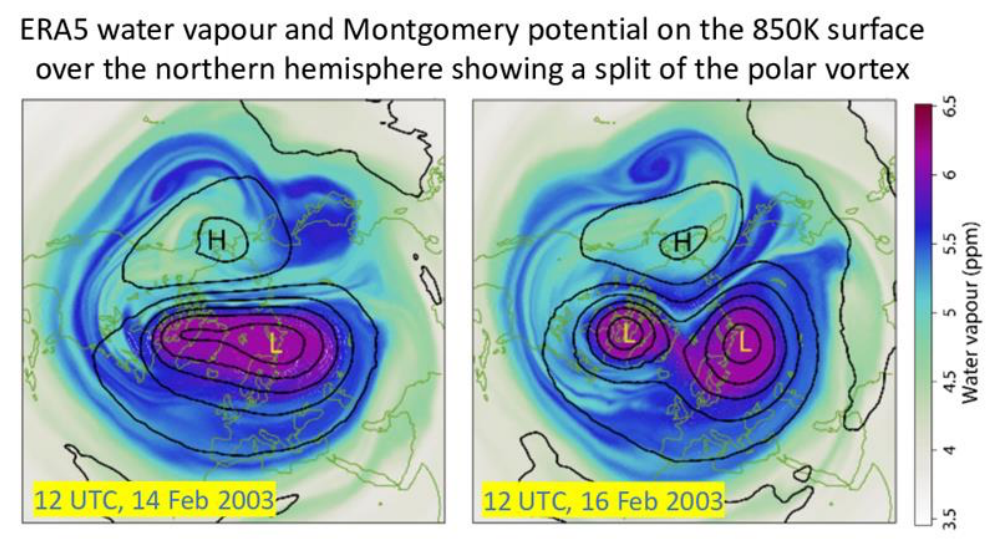
For the US, PRISM gives much finer-scale gridded climate data. Its datasets are available at 4 km and 800 m resolutions and incorporate observations from weather stations together with information such as elevation.
This means a crop monitoring platform can associate weather conditions with the actual coordinates of a field instead of relying exclusively on the nearest weather station. For precipitation data insurance workflows, this can provide a much stronger basis for checking whether rainfall or temperature conditions were consistent with a reported loss.
Matching weather to the claimed loss date
Timing is just as important as location.
Suppose a farmer reports hail damage on June 18. A verification system can look at weather data around that date and check whether the field was exposed to conditions consistent with the claim. It can then compare this with satellite imagery before and after June 18.
The strongest evidence comes when several signals line up:
Before the event: the field shows relatively normal vegetation.
During the reported event: weather data indicates conditions consistent with the claimed hazard.
After the event: satellite imagery shows a significant change in vegetation condition.
For hail damage crop verification, weather data can therefore act as an independent layer of evidence rather than relying on the reported date alone.
There are still limitations. Gridded products are estimates, not direct field measurements, and their resolution may not capture highly localized events such as individual hail cells. This is why the best systems combine weather grids with radar, satellite imagery, station observations, and field-level information where available.
For an agriculture platform, these data sources can be brought together automatically, with AI helping to analyze and compare them automatically. Insurers can then view satellite imagery, weather events, crop history, and claim information in one place, making it easier to spot patterns, identify inconsistencies, and prioritize claims for review.
Farm Records and Crop History: Context that Changes the Analysis
Satellite imagery can show that something changed in a field. Farm records help explain whether that change is unusual and what might have caused it.
For crop loss verification AI, historical data provides context that satellite imagery cannot provide on its own.
Creating a field-specific baseline
Historical yield records show how a particular field has performed over several seasons. Instead of comparing it with a regional average, an AI system can compare current conditions with the field's own history.
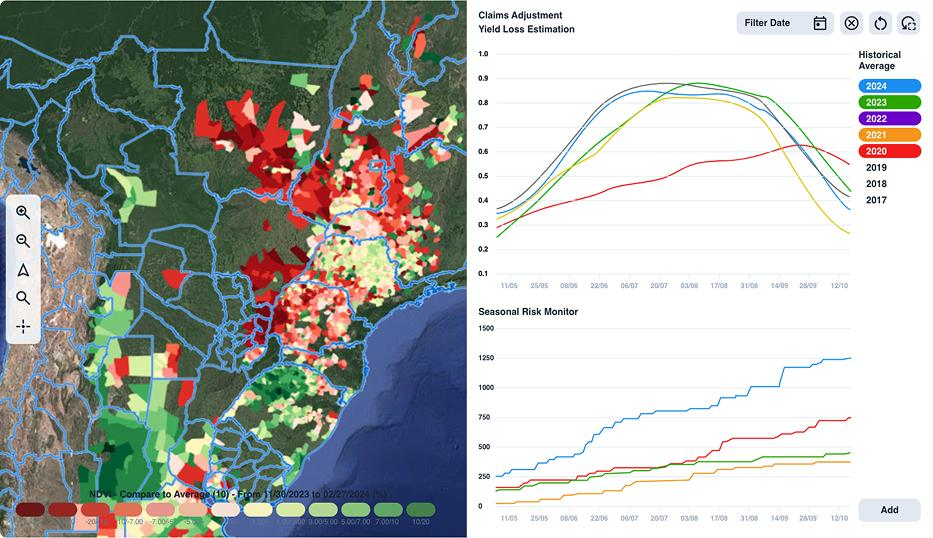
This makes an unusual drop in crop health or yield much easier to identify. The USDA's Actual Production History (APH) guidance provides a real-world example: insurers use a producer's prior production reports to build an APH database and calculate an approved yield, generally using four to ten crop years.
The same signal can mean different things
Crop type and growth stage also matter when interpreting satellite imagery.
A drop in NDVI during late-season crop maturation may be completely normal. The same drop during a period when the crop should be actively growing could indicate stress or damage.
That is why satellite analysis should consider what was growing in the field and what stage it was at when the event occurred, rather than comparing images based only on calendar dates. Research from the USDA shows how accounting for crop growth stages can improve the interpretation of satellite-based crop condition data.
Farm practices explain the changes
Farm records can provide another important piece of context.
Irrigation records, for example, may explain why one part of a field remained healthy during a dry period. Pest treatment records can help explain why vegetation stress appeared and then improved in subsequent images.
Planting dates, fertilizer applications, and harvest records can provide similar clues. Without this information, an AI system may flag normal farm activity as potential crop damage.
Multi-source Correlation: From Data to Claim Priority Score
No single data source can reliably verify every crop loss claim. Satellite imagery shows what changed, weather data can confirm whether an event occurred, and farm history provides context for what the field normally looks like.
An AI farm claims automation system can bring four main sources together:
• Satellite evidence: Did vegetation health change after the reported event?
• Weather data: Was there a weather event in the same location and timeframe?
• Crop history: Was the field performing differently from its usual baseline?
• Claim documents: Do the reported date, location, crop, and type of damage match the available evidence?
Turning evidence into a priority score
The system can then assign each claim to a review category based on how well the different sources agree.
Fast-track approval
Multiple sources support the claim. The reported event matches the weather data, satellite imagery shows the expected change, and the field's history supports the assessment.
Standard review
The evidence is generally consistent, but some information is missing or inconclusive. An adjuster can review the available data without treating the claim as an immediate concern.
Investigation priority
Important inconsistencies appear between the claim and external data. For example, the reported hail date may not match available weather evidence, or satellite imagery may show little or no corresponding change in the claimed area.
The score should not be treated as an automatic approval or rejection. Its purpose is to prioritize human attention, directing straightforward claims through a faster path while sending ambiguous or inconsistent cases for closer investigation.
This is how farm data AI application can perform the initial cross-check and present the evidence behind each priority level.
The Adjuster İnterface: What AI Outputs Actually Look Like
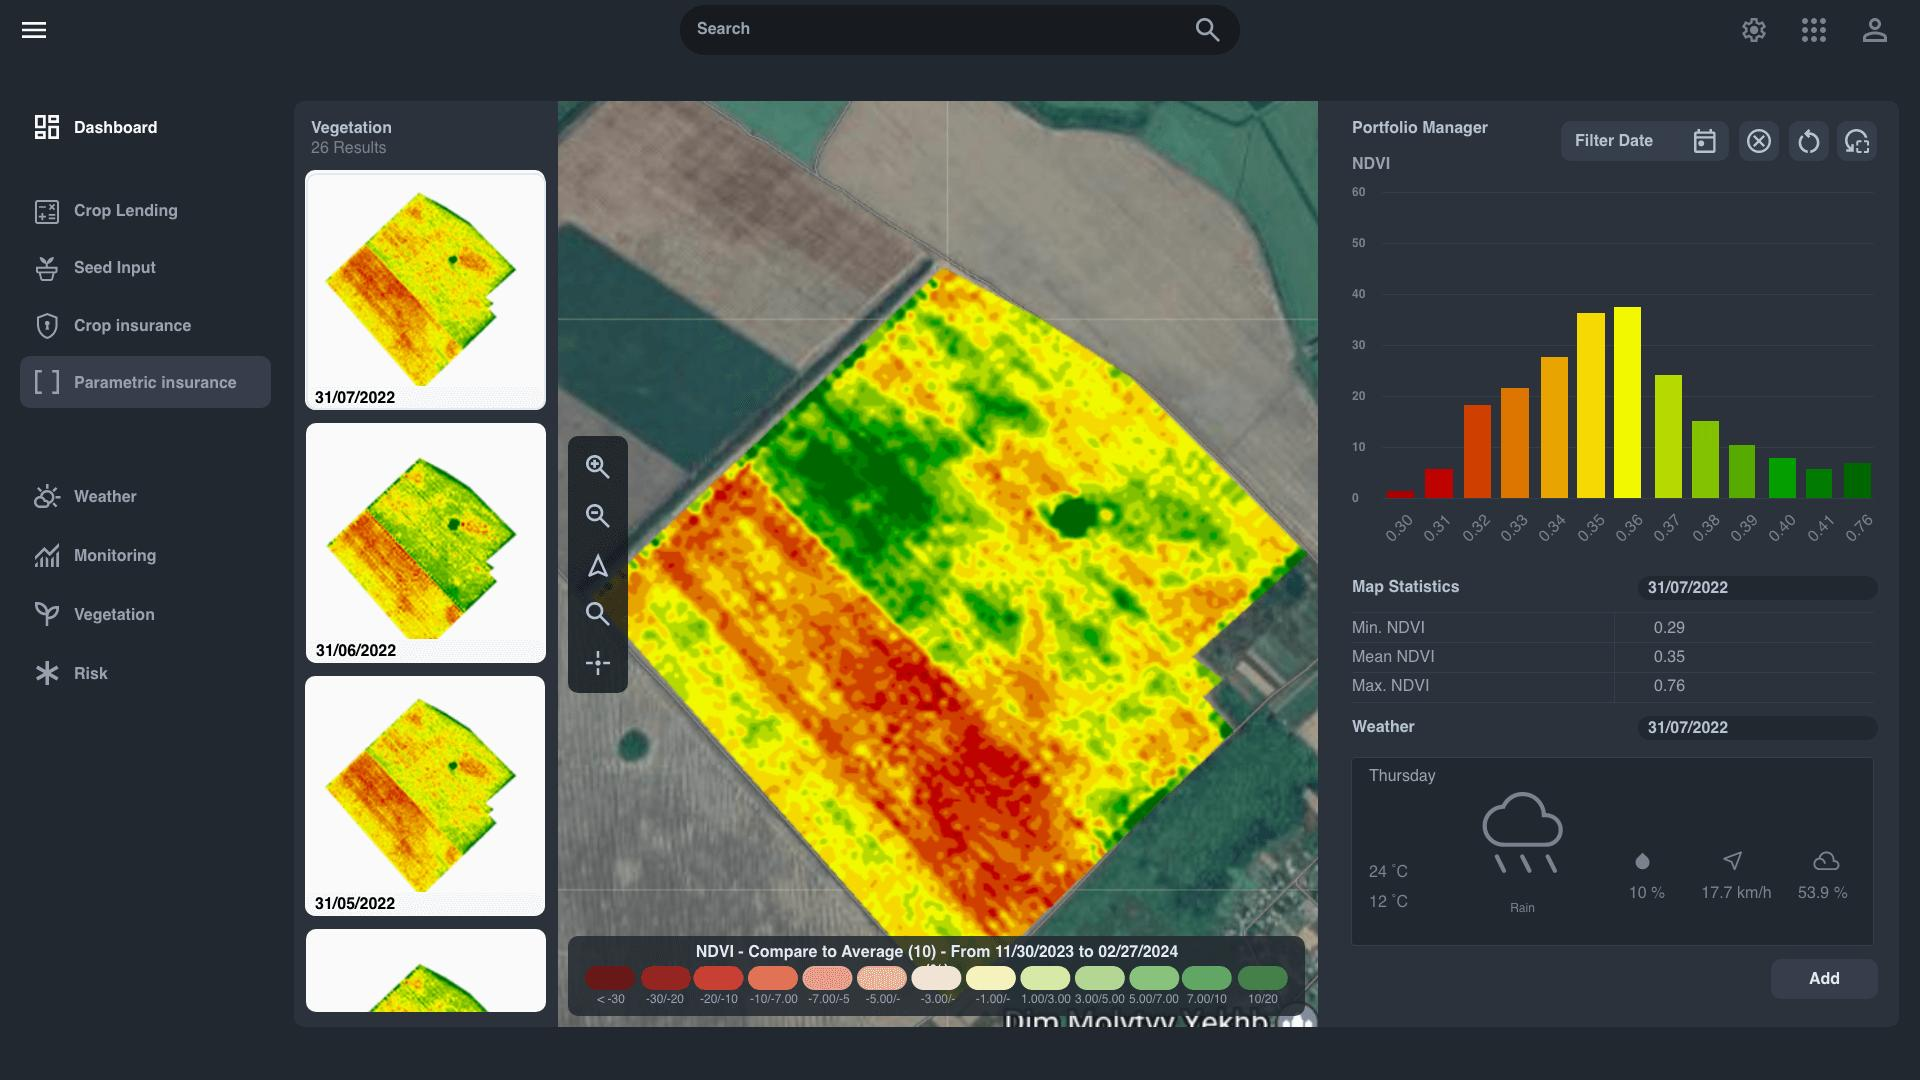
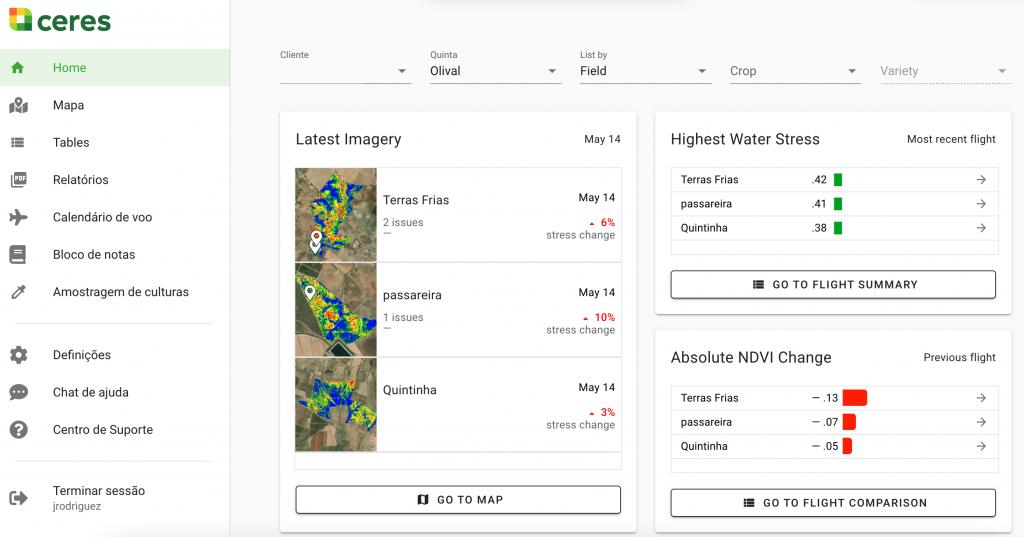
AI is most useful when it turns complex data into something an adjuster can review quickly. Instead of replacing the adjuster, it works in the background as their analytical infrastructure, bringing relevant evidence into one place.
An adjuster might see:
• Map view: The insured field with satellite imagery, field boundaries, and areas where crop conditions changed.
• Weather timeline: The reported loss date alongside relevant precipitation, hail, temperature, or other weather events.
• Confidence indicators: A clear view of how strongly the available evidence supports the assessment and which data is missing or uncertain.
• Crop history: Historical yield and vegetation data showing how the field compares with its normal performance.
• Pre-populated form: Claim details and relevant findings already added to the adjustment form, so the adjuster can verify the information instead of entering it manually.
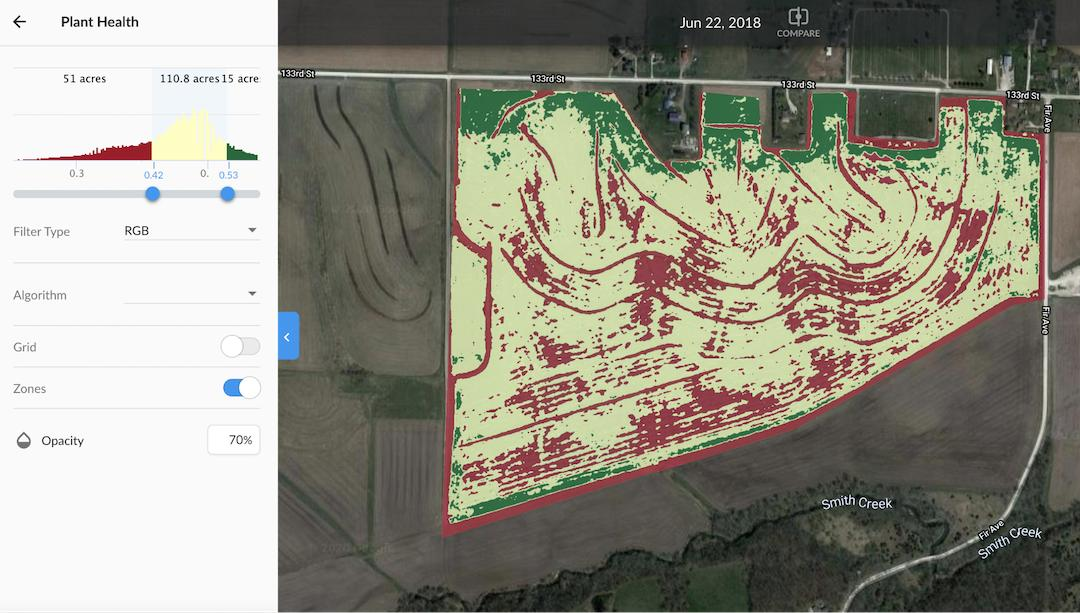
The interface should also show why the system reached its conclusion. If a claim is marked for investigation, the adjuster might see that the reported hail event does not match available weather data or that satellite imagery shows little change in the claimed area.
This kind of dashboard is not unique to agriculture. In our article on AI use cases in construction safety, we explore a similar approach: bringing data from different sources into one view and turning it into ranked alerts and actionable insights.
The principle is the same here. AI handles the repetitive comparison and surfaces the evidence, while the adjuster remains responsible for interpreting the case and making the final decision.
Build Your Crop İnsurance Solution with AI
Perpetio builds custom AI solutions for data-heavy businesses, helping teams turn complex information from multiple sources into practical, scalable software. Our work spans industries such as agriculture and healthcare, where large datasets, automation, and reliable data processing can make complex workflows easier to manage.
If you're exploring agritech AI development or crop insurance platform development, learn more about our AI development services or get a free tech consultation (no strings attached).
How does AI use satellite data to verify agricultural insurance claims?
AI can analyze satellite imagery from before and after a reported event to detect changes in crop health, vegetation density, and affected areas. By comparing this data with the field's historical condition and weather records, it can help determine whether the observed crop loss is consistent with the insurance claim.
What is NDVI and how is it used in crop loss verification?
NDVI (Normalized Difference Vegetation Index) is a satellite-derived measure of vegetation health based on how plants reflect red and near-infrared light. In NDVI crop loss analysis, AI can compare NDVI values before and after an event to identify unusual declines in vegetation that may indicate crop stress or damage.
How is weather data used to validate farm insurance claims?
Weather data helps determine whether the reported event occurred in the claimed location and timeframe. A claims system can compare the loss date and field coordinates with precipitation, temperature, hail, wind, or other relevant weather records.